Your daily tangible screen time
Concept Design | Physical Interface | Information Design
"The most profound technologies are those that disappear. They weave themselves into the fabric of everyday life until they are indistinguishable from it”
— Mark Weiser, Xerox-PARC
In an era dominated by screens, technology enhances our capabilities but also leads to increased distractions and diminished social interactions. Paradoxically, many solutions to digital overload rely on more screens—time management apps and notifications—further contributing to the problem.

Problem Statement
The information age is flooded with screens, enhancing our capabilities yet increasing distractions and diminishing social interactions
How might we design an ambient, non-intrusive solution that seamlessly visualizes digital habits at a glance, fostering awareness and positive behavioral change without adding to screen fatigue?

Solution
An ambient, non-intrusive display that visualizes digital habits through subtle cues like light or motion—offering real-time awareness without screens or notifications.
This seamless approach fosters mindful engagement, helping users build healthier digital habits while reducing distractions.
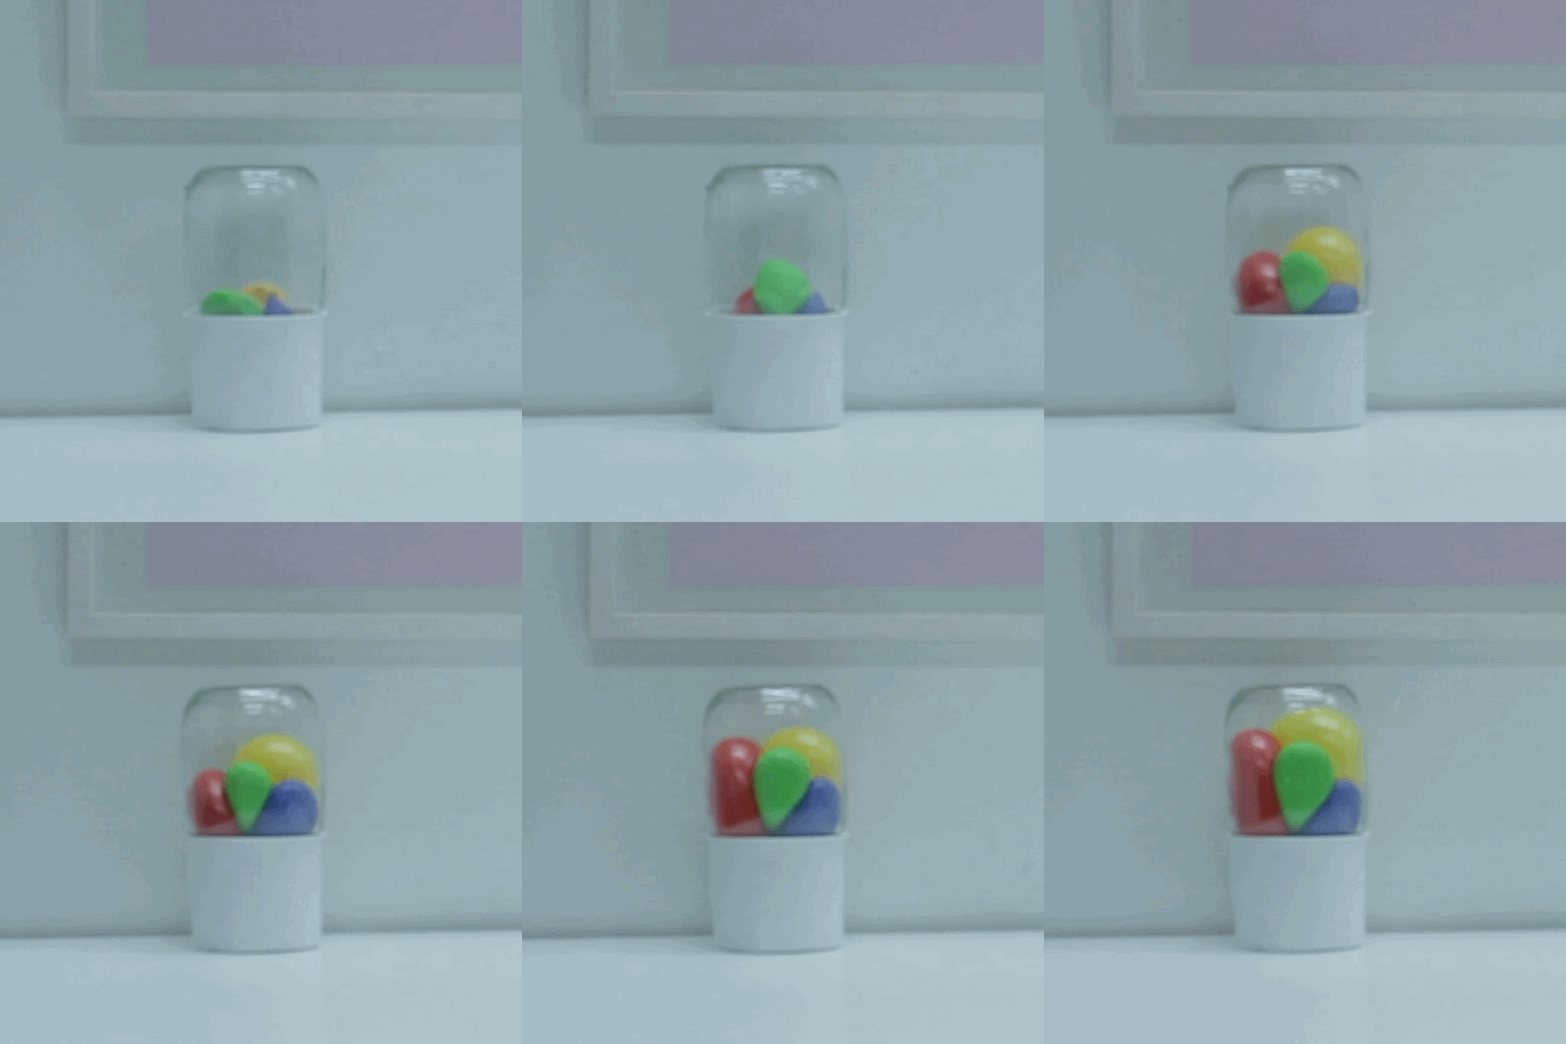
In the right image, I experimented with dynamic ways to project data through tangible visualizations, ultimately bringing the balloon concept to life!


Building the Concept
-
Firstly I took in account of time spent on several activities by me which is then broadly split into four categories based upon the activities.
-
To make the measurements calculative, the time data used in this scope is the time spent on the digital devices like desktop or mobile.
-
This time is recorded using the RescueTime (time tracking tool) desktop app and extracted every 30 mins using RescusTime API and node.js.

-
Hereafter, Processing(P3) environment is used to simulate the data into a 2-D visualisation.
-
The above GIF shows time duration for each of the categories on a 24hr timeline on 07/12/2017.
-
Simulated in Processing(P3) using Node.js and RescueTime API


Physical prototype development using ESP32 Micro-controller, Mini Air compressor and battery supply

Visualisations of data recorded from 11th to 17th Dec, 2017 using RescuTime API
